Nevada President Results
Race Details703,486
669,890
Votes
Early voting in Nevada
In Nevada, all registered voters are automatically mailed a ballot. They can also vote early in-person. In 2016, 69% of the total votes were cast early.
Mail-in and early in-person ballots returned1,338,639
Nevada Primary election results
Democratic Primary/ 36 Del.36 Delegates
Full Nevada Primary Results- DEM
Bernie SandersWinner
46.8%6,788
+ 24 Delegates
- DEM
Joe Biden
20.2%2,927
+ 9 Delegates
- DEM
Pete Buttigieg
14.3%2,073
+ 3 Delegates
Republican Primary/ 25 Del.25 Delegates
- Republican
Donald TrumpWinner
+ 25 Delegates
How Nevada voted
In 2016, Hillary Clinton won Nevada with 48 percent of the vote, according to NBC News results, while Donald Trump received 46 percent. Considered a swing state, Nevada has seen close contests over the years. The state voted for Democrat Bill Clinton twice before backing Republican George W. Bush twice. The state then voted for Barack Obama in 2008 and 2012 before giving Hillary Clinton a narrow victory in 2016.
2016
2016 Results- Democrat
Hillary ClintonClintonWinner
47.9%539,260
- Republican
Donald TrumpTrump
45.5%512,058
2016 Exit Polls
Summary of 2016 Exit Poll data that shows the proportion of how different groups voted.
2012
2012 Results- Democrat
Barack ObamaObamaWinner
52.4%531,373
- Republican
Mitt RomneyRomney
45.7%463,567
2012 Exit Polls
Summary of 2012 Exit Poll data that shows the proportion of how different groups voted.
More to the story in Nevada 2020
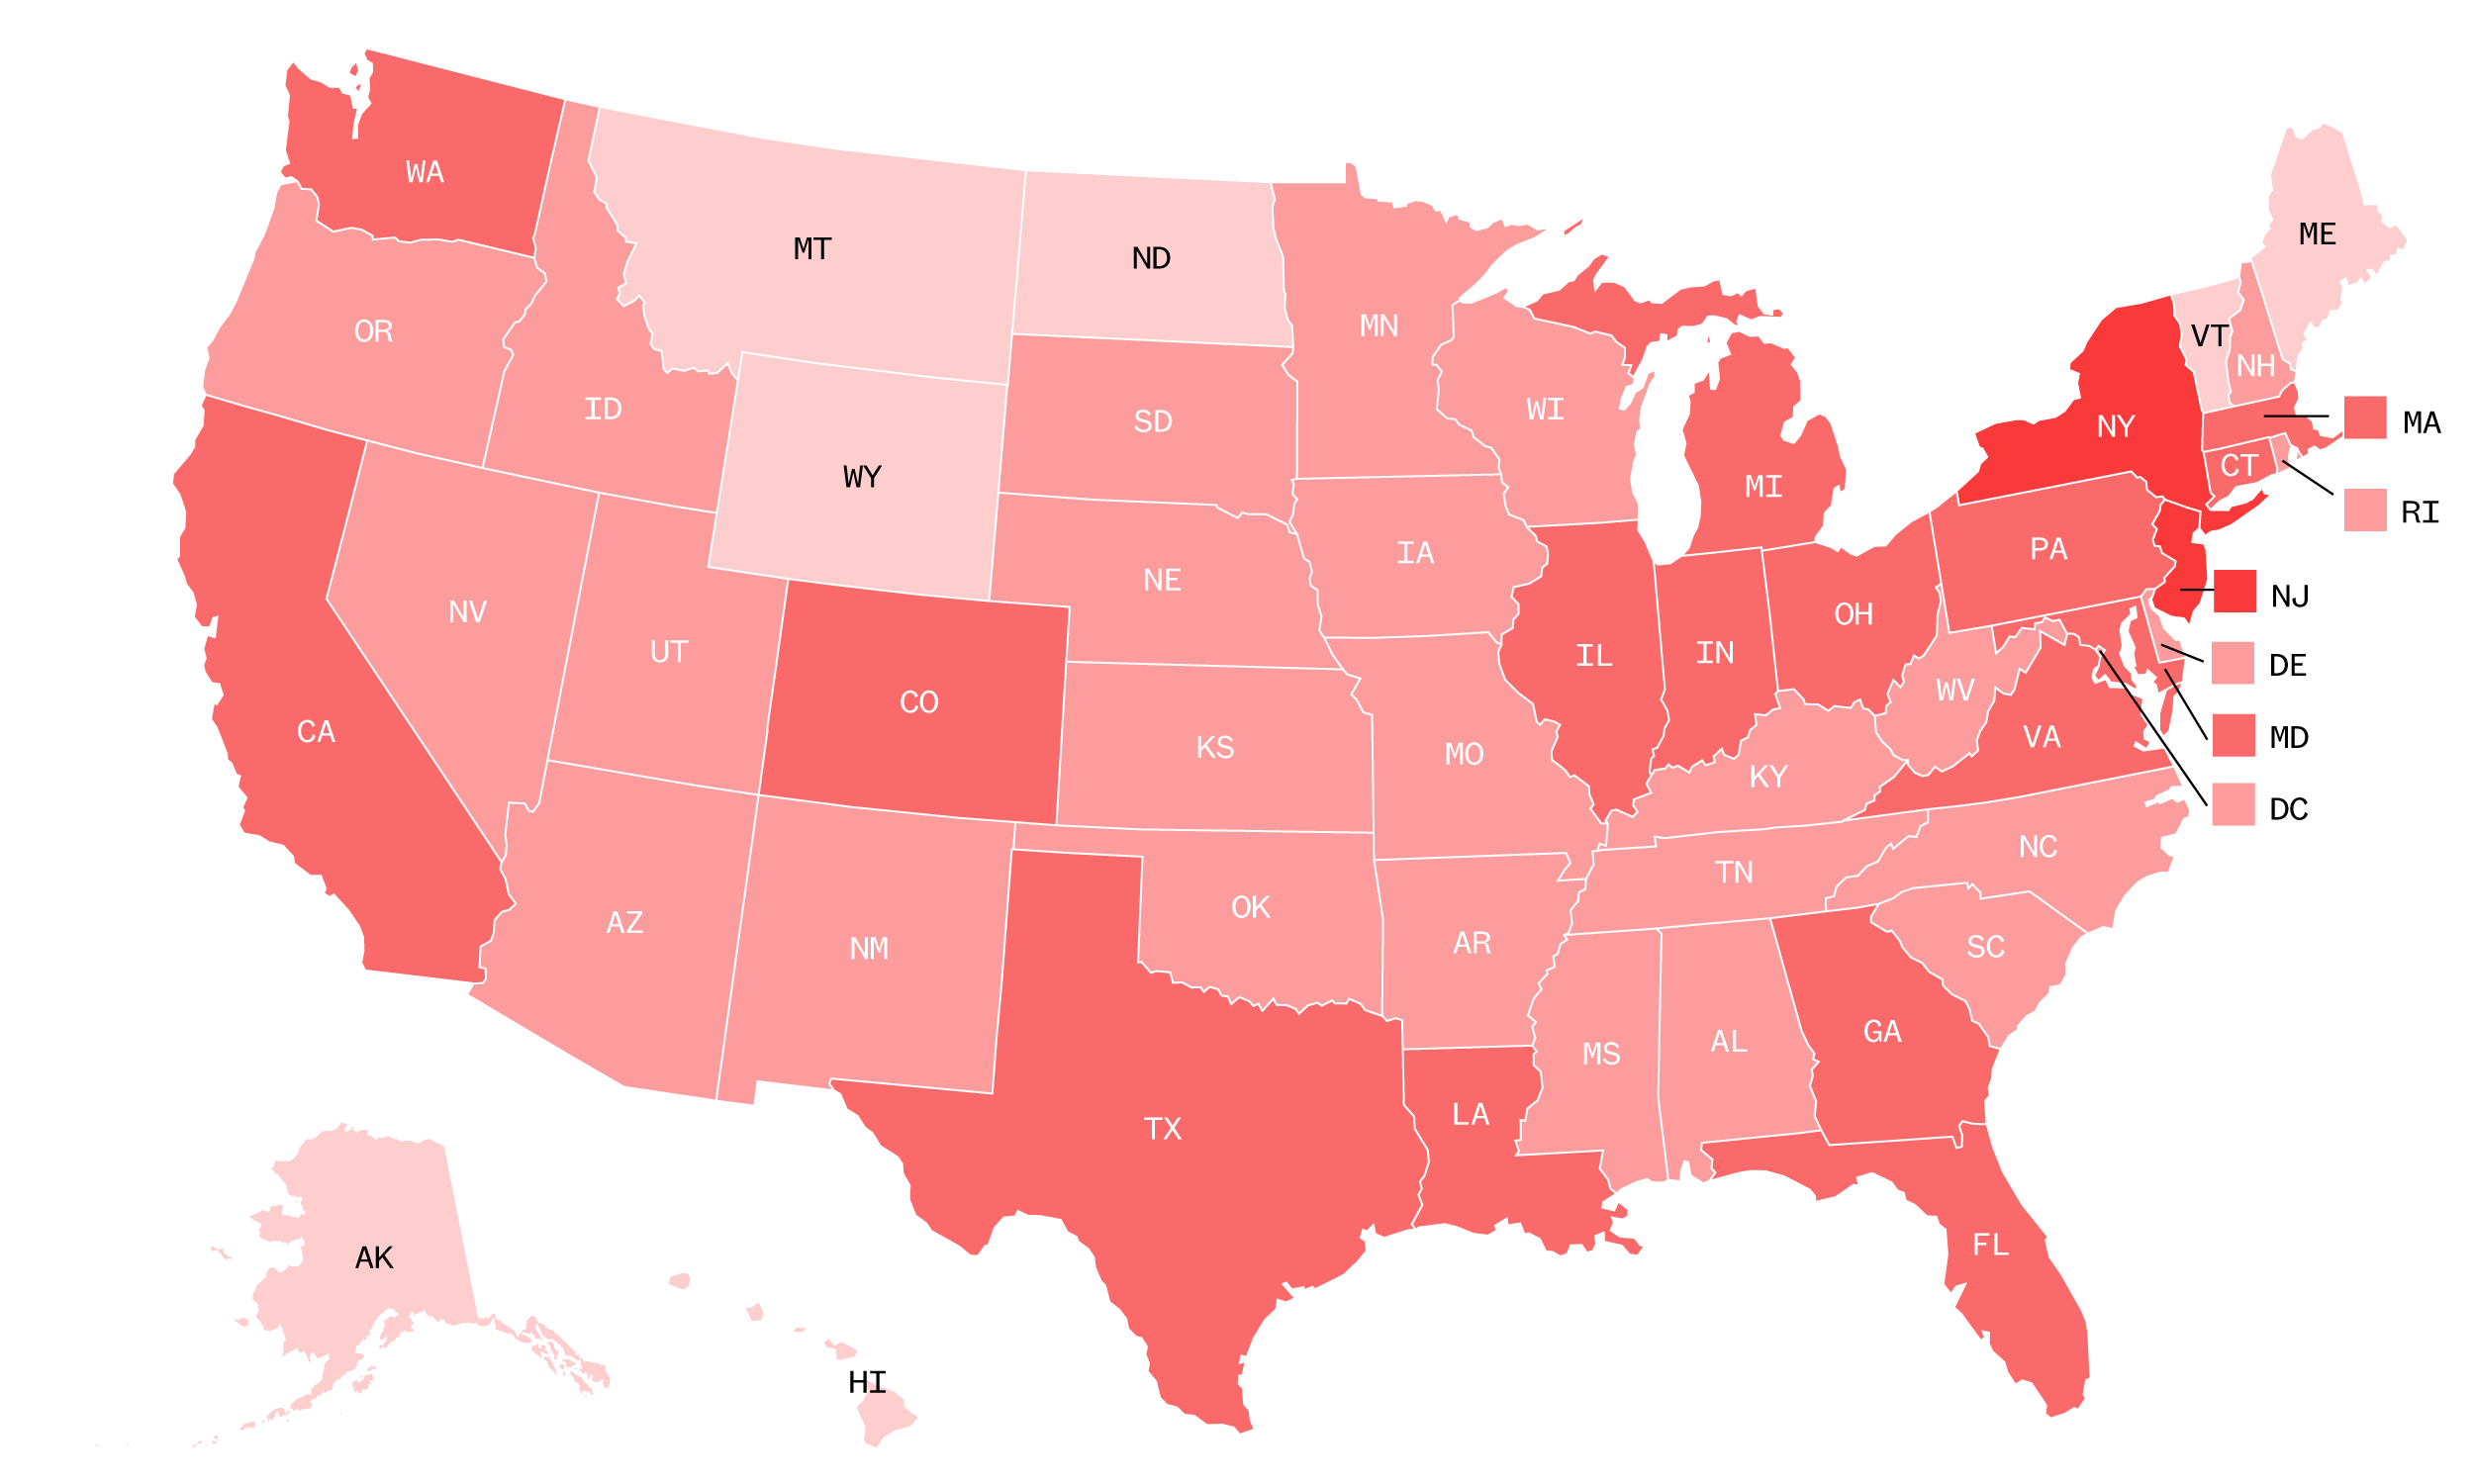
The coronavirus pandemic and its devastating economic fallout are two major issues that have an impact on the election. NBC News is tracking and updating daily the number of coronavirus related deaths in each state and U.S. territory, as well as the jobless claims as reported weekly by the Department of Labor that counts how many people have filed for unemployment benefits.
| U.S. Cases | Weekly change | 60-day trend | Monthly change |
|---|---|---|---|
| 100,472,464 | +0.00% | +0.00% | |
| 874,117 | -26.00% | +84.00% |
| U.S. Claims | Weekly change | 60-day trend | Monthly change |
|---|---|---|---|
| 3,690,000 | +1.01% | -0.99% | |
| 80,509 | +0.74% | +17.08% |
The expected vote is the total number of votes that are expected in a given race once all votes are counted. This number is an estimate and is based on several different factors, including information on the number of votes cast early as well as information provided to our vote reporters on Election Day from county election officials. The figure can change as NBC News gathers new information.
Source: National Election Pool (NEP)
More 2020 coverage