Researchers have mapped out deaths from alcohol, drugs and violence across the U.S. and found troubling patterns of despair that have worsened in recent years.
While deaths from alcohol abuse, suicide and violence are down, they are more than outweighed by a gigantic 600 percent increase in drug overdose deaths, the team at the University of Washington found.
Their county-by-county breakdown of mortality data going back to 1980 paints an extremely detailed picture of where society is failing the most Americans.
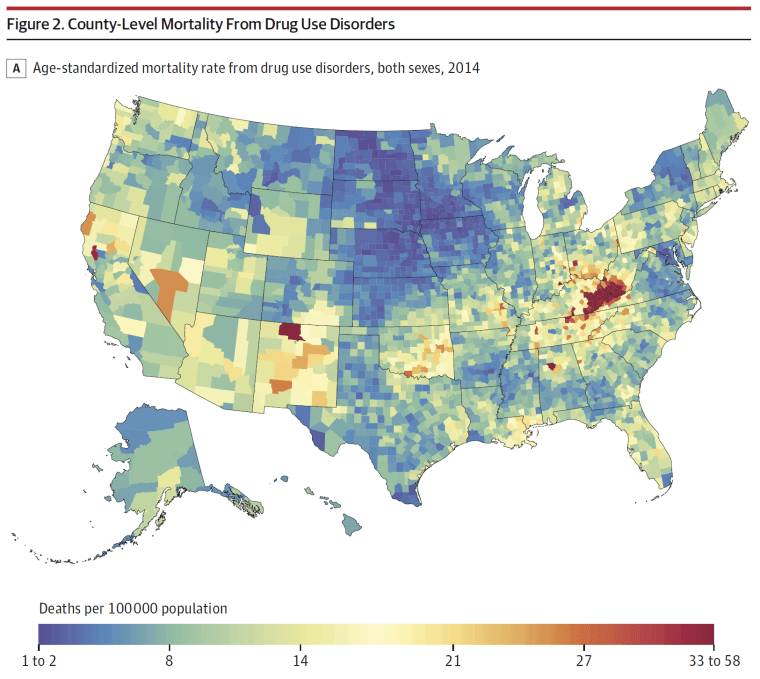
“Every county experienced an increase in deaths from drug use disorders, but that burden of drug use overdoses was particularly acute in certain communities,” Laura Dwyer-Lindgren and colleagues wrote in their report, published in the Journal of the American Medical Association.

Drug deaths cluster in Appalachia. A map showing the rate of increase is even more dramatic, showing hot spots of worsening drug overdoses in Appalachia, Ohio, Indiana, Oklahoma, New Hampshire and Massachusetts.
Dwyer-Lindgren and colleagues at the university’s Institute for Health Metrics and Evaluation evaluated data on 2.8 million deaths from 1980 to 2014.
“Mortality rates varied widely among counties and increased by 618.3 percent for drug use disorders but decreased by 8.1 percent for alcohol use disorders, 6 percent for self-harm, and 44.9 percent for interpersonal violence,” they wrote.
'Despair deaths'
The report and the maps are looking at data alone. They offer no explanation about possible causes.
But other research explains many of the causes. Access to health care and jobs and the availability of alcohol all influence alcohol deaths. Availability of guns is strongly linked with deaths by suicide.
The rise in opioid deaths is more complicated, but is partly linked to poor access to health care, loss of jobs, and heavier use of opioids to treat pain.

This year, a report from the Trust for America’s Health and the Well Being Trust found an 11 percent increase in deaths from drug or alcohol overdoses and from suicide from 2015 to 2016, and called them “despair deaths.”
Whatever the cause, it's affecting overall life expectancy in the U.S.
The National Center for Health Statistics said 63,600 people died of drug overdoses in 2016 — enough to drive down overall U.S. life expectancy for the second year in a row.
The University of Washington teams looked both at death rates in 2014 alone, and at the change in death rates since 1980.
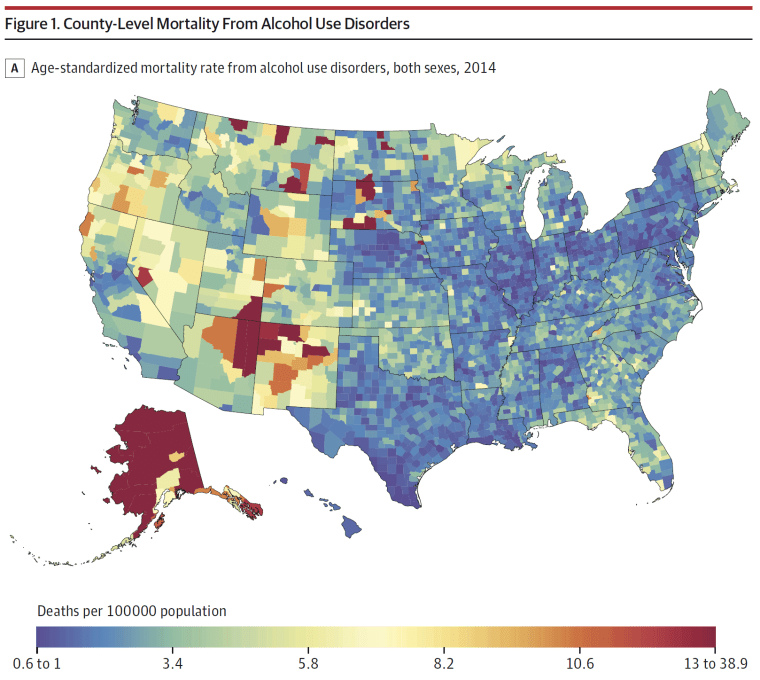
The highest rates of alcohol-related deaths are found in areas with high Native American and Alaska Native populations — Alaska, the Navajo nation where the borders of Arizona, New Mexico and Utah meet, and in parts of the Dakotas and Montana.
That’s not new — in 2008, the Centers for Disease Control and Prevention reported that 12 percent of the deaths among Native Americans and Alaska Natives are alcohol-related, more than three times the general population.
But when out into context with other types of violent and self-inflicted death, the patterns paint a picture of suffering and desperation.
Self-harm was highest in 2014 in Alaska and the western states of Nevada, Utah, northern Arizona, Wyoming and New Mexico in particular, with hotspots in Alabama, the border of Virginia, West Virginia and Kentucky, parts of Tennessee and Arkansas. Rates are noticeably low in the New York City area, Southern California, Chicago, South Texas, Iowa and Minnesota.
The maps show huge decreases in deaths from interpersonal violence, which includes domestic violence and childhood physical and sexual abuse, across Texas, Florida and Southern California, as well as the mid-Atlantic, with the biggest increases in the upper Midwest and Wyoming.


